-from Epidemiological
Bulletin , Vol. 25 No. 1, march 2004 -
Situation of Severe Growth Retardation in First-grade
Schoolchildren in Countries of Central America Around 2000
Introduction
The nutritional status of schoolchildren is a relevant aspect of health situation
analyses. This status can be seen, on the one hand, as a reflection of life
conditions, human development, food safety, and the health of children and,
on the other, as an indicator of the risk (vulnerability) to develop acute/severe
episodes of malnutrition and other health impairments. Chronic malnutrition,
which is reflected in growth retardation among school-age children, is the
most frequent form of malnutrition of the Region of the Americas1.
According to data published by the Pan American Health Organization (PAHO),
the Central American countries have long presented levels of malnutrition in
the population of children, in many cases, serious malnutrition. For example,
in Honduras the prevalence of malnutrition in children under 5 increased from
48.6% in 1987 to 52.5% in 1991, and 2.1% of deaths in children were associated
to malnutrition. Moreover, in Guatemala, there were 45 deaths per 100,000 population
due to malnutrition in 1994, while the Survey of Sentinel Schools showed 64%
of girls and 75% of boys under 6 had a height-for-age deficit. Meanwhile in
El Salvador, the 1993 National Family Health Survey determined that the prevalence
of low height for age in children under 5 was 22.8% 2.
The measurement of height-for-age of schoolchildren represents a simple method
for the evaluation of the average nutritional status of a population. In turn,
the evaluation of growth retardation through periodic height censuses allows
monitoring the nutritional status of a population and confirming changes on
it. This and other information allows the analysis with various regional risk
factors. The objectives of this first paper were: 1) to define the magnitude
and distribution of the prevalence of Severe Growth Retardation (SGR) in schoolchildren
in countries of Central America; and, 2) to evaluate the relationship between
nutritional status and selected environmental risk factors.
Materials and methods
The area of study covers three contiguous countries of Central America: El
Salvador, Guatemala, and Honduras. Estimates for the year 2000 indicate that,
together, these countries had an approximate total population of 24.1 million,
living in about 900 municipalities3.
The population under study involved first grade schoolchildren of both sexes,
ages 6 to 9 years. The data come from the National Schoolchildren Height Census
of El Salvador in 2000, Guatemala in 2001, and Honduras in 1997.
The nutritional status was assessed through height-for-age measurements, through
an anthropometric methodology and previously validated standard instruments4.
Children’s SGR was defined as three or more standardized normal deviations
(z-scores) of individual height with respect to the standard reference for
age and sex, according to the World Health Organization5,6,7. The individual
data were summarized in tables, histograms and boxplots utilizing the statistical
package SPSS8.
The analysis of the nutritional status was also done at the population level,
with municipalities as units of analysis. To this end, the individual database
was consolidated in accordance with the scores, and the proportion of SGR was
calculated in children studied in each municipality.
The geographic data of the national and first
subnational levels were obtained from the World Digital Atlas and reviewed
by PAHO9. This electronic database is to the 1:100,000,000 scale. The geographical
databases for the second subnational level were provided by the Ministry of
Agriculture and Livestock of Guatemala10, by the Honduras and El Salvador Ministries
of Health and the Digital Atlas of Central America, prepared by several institutions
in response to Hurricane Mitch11, compiled by PAHO. Given the fact that at
the time of this evaluation, there is no information on food availability and
production at the municipal level for the study area and, given the recognized
influence of the environmental factors on food production, the environmental
information is analyzed using proxy indicators such as terrain access conditions
and land use. Access problems are positively related to topography12,13. For
this study topography was obtained and calculated from the Digital Elevation
Model (DEM) based on data from the United States Geological Survey14. Two tiles
were employed, W140N40 and W100N40 for the construction of the Irregular Triangular
Network (TIN) and slope features calculated each 250 meters above sea level
for the set of the three countries. Land use is commonly associated with the
distribution of major natural ecosystems and land exploitation patterns for
agriculture, livestock, forest, or urban settings15. Land use is evidence of
man’s action on the geographical
environment. Its alterations are direct outcomes of the development of economic
activities16. The influence of environmental factors on food vulnerability
is linked to its aptitude for agriculture activities, where soil quality is
essential, but varies in relation to drainage, elevation gradients, erosion,
temperatures, and rains17. Among countries with low tech agriculture activities,
distribution of agricultural land use has a decisive impact on food availability18,19.
For geographical analysis, the geographic information systems package SIGEpi20
was used, developed by PAHO20. In order to link the geographical layers with
data on the prevalence of SGR, the municipal codes of each country were used
as reference keys. Thematic rank choropleth maps were prepared with the variables
of interest, using the quantile method for the classification of units. Furthermore,
various area spatial queries were used to determine the geographical relation
of critical areas of SGR to the selected risk factors.
Results
Based on the height census, information on 782,905 children was included, 21.7%
from El Salvador, 48.6% from Guatemala, and 29.7% from Honduras (Table 1).
Among the total of surveyed schoolchildren, 48.3% were female, where the
proportion was similar in all countries. With respect to the ages, the children
from Honduras were, on average, 6 and 8 months younger than those from El
Salvador and Guatemala, respectively.

Table 1: Distribution of studied population for each country, sex and average
values and standard deviation by age, height and Z score, around 2000.
The average height of the entire population studied was 115.7 cm (standard
deviation of 6.86); this average was 4 and 6 cm greater in El Salvador (119.2
cm), than in Guatemala (115.7 cm) and in Honduras (113.2 cm), respectively.
The average subregional values for men and women were 116.1 and 115.3 cm; this
difference of 1 cm between sexes was similar in the 3 countries. The distribution
of height values per country is presented in Figure 1, showing a displacement
to the left of the curve and height average in Honduras compared to Guatemala,
and Guatemala compared to El Salvador.

Figure 1: Distribution of height in first-grade children in El Salvador, Guatemala,
and Honduras from National Census around 2000
The Z score was used to consider the effects of age and sex on the population
height comparisons. The average subregional Z-score for height with regard
to the standard population was of -1.72 (Table 1), which indicates that, on
average, children of the subregion are smaller than the reference children.
The lower value was observed in Guatemala (-1.94) and the highest in El Salvador
(-1.12), while the value in Honduras was in a situation closer to that of Guatemala
(-1.79). Even though the height averages were greater among boys than girls,
the Z-scores average of—1.82 and -1.61 indicated a less favorable situation
among men than in women compared to the standard. The differences between men
and women are maintained at the country level. The distribution of the Z-scores
at the country level indicates that a segment of the populations of each of
them is an important disadvantage with regard to the standard (Figure 2), although
in Guatemala and Honduras nearly half are two or more deviations away from
the reference, in contrast with El Salvador where less than 25% are in that
position. Furthermore, in Honduras a greater dispersion is observed with more
extreme Z values, also suggesting important inequalities.
Figure 2: Distribution of Z scores of height with respect to the reference in
first-grade children, by country, around 2000
A total of 12.3% of the studied schoolchildren at the subregional level showed
a SGR (Table 1). In the different countries, SGR was 3.1% for El Salvador,
14.5% for Guatemala, and 15.2% for Honduras; an excess risk of SGR being noted
among boys compared to girls, from 53 to 100%, independent of the level of
retardation in the countries. At the subregional level, a sustained increase
in the frequency of SGR with age was also noted, from 8.8% at 6 years of age
up to 12.3% at 9 years, but the levels are significantly lower in El Salvador
(Figure 3). According to sex, the rising trend, and the excess among boys remains
relatively constant, regardless of the level of the country. A higher prevalence
is observed among boys in Honduras, which increases as age does, like the slope
of the curve shows. In view of this trend, and considering that the average
age of schoolchildren in the Honduran Census was younger than in El Salvador
and Guatemala (which is also reflected in a smaller average height in Honduras),
it is expected that, if the growth retardation frequency with age were maintained
and older children were included, the prevalence of SGR would also be higher
in Honduras.
Figure 3: Prevalence of severe growth retardation in first-grade children in
Centroamerican countries, by sex, around 2000
In Map 1, the geographical distribution of SGR prevalence is presented at
the municipal level for the three countries. When classified by quintiles,
the prevalence of SGR was found to be lower than 3.6% in 178 (20%) of the 888
municipalities with 134,872 schoolchildren, 2,808 of which presented SGR. In
contrast, another fifth of the municipalities, with 100,329 schoolchildren,
shows levels higher than 22%; however, among these some units had prevalence
figures of up to 72.7%. The municipalities that belong to this superior quintile
can be defined as the most critical areas, where 31,679 of the schoolchildren,
i.e. nearly 30% have SGR. Municipal clusters can be identified where the prevalence
of severe deficit is higher than 21% for the west of Honduras and Guatemala,
but not for El Salvador, which suggests the existence of some factors that
increase risk in such areas.
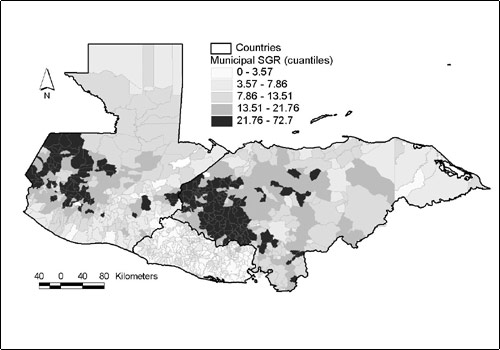
Map 1: Distribution of severe growth retardation in first-grade schoolchidren
in the countries under study at the municipal level, around 2000
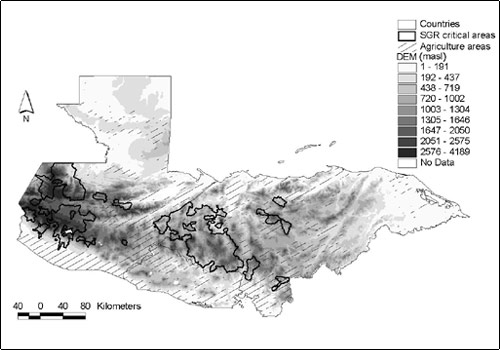
The environmental factors under study integrate some elements that could influence
the production, availability or access to food supplies. Under abrupt topographic
conditions, areas that would have greater access difficulties cover Western
Guatemala mountain areas, which continue towards the South East, along the
border between Honduras and El Salvador (Map 2). This ecosystem is known as
the Central American pine-oak forest, typified by mixed needle and broad leaves
mountainous woodland21 (Map 3). Information about natural or man’s modified
ecosystems’ distribution was integrated and measured, taking into account
the proportion of agricultural land use with respect to the municipal total
surface (Map 4). Land use patterns corroborate that more intensive agricultural
activities predominate along the South East coasts, as well as over the piedmonts
surrounding the pine-oak forest ecosystem.

Map 2: Digital elevation model in the countries under study
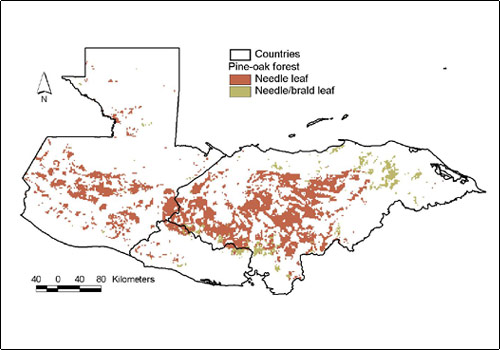
Map 3: Location of pine-oak forest ecosystem according to the soil in the countries
under study

Map 4: Location of agriculture zones
With geo-processing and digital maps overlapping, the spatial allocation of
the critical areas of SGR was analyzed simultaneously with different environmental
factors. Critical areas of SGR concur geographically with the ecosystem pine-oak
forest, on top of areas of abrupt topography and the additional factor of being
located over low agricultural occupation lands. This, besides their adversity
for farming activity are also characterized by their low access and coverage
of basic services. In turn, critical areas of SGR are apart from terrain agricultural
vocation (Map 5).
Map 5: Critical areas or SGR prevalence over agriculture zones and abrupt topography.
Conclusions
The situation analysis of nutritional status based on height census in countries
of Central America indicates that SGR is a very frequent public health problem,
that deserves special attention in some areas of El Salvador, Guatemala and
Honduras. Although SGR is an indicator of chronic malnutrition, it is important
to note that vulnerability or risk of developing acute malnutrition episodes
increases with the frequency and severity of observed growth retardation
among populations. Distribution of heights and Z-scores by country shows
that growth retardation is particularly precarious in Honduras; however,
high levels of SGR prevalence of (>22%) also affects groups of municipalities
in Guatemala, which means that any intervention should consider both countries.
The present study shows that geographical conditions linked to topography,
type of soil and other socioeconomic status are associated with the levels
of SGR. Unlike the results presented in graphs, map modelling allows the identification
of spatial aggregation patterns such as the ones described for Honduras and
Guatemala (Martínez et al,22) and the relation with other factors that
have different distributions to the political-administrative division, such
as land use, and topography. The measurement of environmental factors associated
with the risk of SGR, suggests that the identification and monitoring of high-risk
populations through such indicators is feasible. However, it is necessary to
consider that there exist other social, economic and health factors that have
an impact on the nutritional status and growth retardation.
For instance, Nájera-Aguilar et al23. have found in Honduras, that
there is a high spatial correlation between municipalities with SGR clusters
and an elevated proportion of indigenous population, as well as low services
availability (i.e. roads, health, municipal services as water and drainage).
But this is happening just over abrupt topography areas. The latter indicates
the existence of multiple variables that must be analyzed, in order to establish
their relative importance in the other countries.
The present study shows an ecological analysis, where the information collected
from different sources of information is taken advantage of, both health conditions
at municipal levels, and the continuous surfaces that correspond to environmental
characteristics - satellite images-. Accordingly there are some limitations
on the inferences interpretation.
In the results explanation, it is also important to take into account that
schoolchildren included in the census do not necessarily represent all children
between 6 to 9 years old, a situation associated with the access to schools,
besides customs of incorporating them early, to productive activities inside
and outside the home, as occurs particularly in rural areas. This could mean
an underestimation of SGR prevalence if the children not included are from
the lowest socioeconomical levels living in mountainous areas. However, in
order to evaluate the representativeness of these census, it is worthwhile
to indicate that in Guatemala it was an estimated coverage of nearly 97% of
the public schools4, validating that the estimates of prevalence of SGR are
an expression of the country’s situation.
In short, the high frequency of SGR in countries of the Central American subregion
points out the need for establishing programs and policies aimed at diminishing
its occurrence and impact. The Millennium Development Goals contemplate the
reduction of poverty, hunger, and malnutrition24; the present situation analysis
reflects a first step for the process of monitoring and orientation of plans
and policies to address such a situation. Moreover, the use of the information
on height census allows evaluating the magnitude and distribution of SGR, identifying
areas or epidemiological strata having similar risk determinants where specific
health interventions may be directed.
References:
1) Organización Panamericana de la Salud (OPS). Enfermedades de la nutrición
y el metabolismo. En: La Salud en las Américas, 1998. Vol I. Publ Cient
No. 569. OPS: Washington, D.C., 1998. pp:161-168
2) Organización Panamericana de la Salud (OPS). La Salud en las Américas,
1998. Vol II. Publ Cient No. 569. OPS: Washington, D.C., 1998.
3) Organización Panamericana de la Salud (OPS). Situación de
Salud en las Américas. Indicadores Básicos 2002. OPS: Washington,
D.C., OPS/SHA/02.01, 2002
4) Gobierno de la República de Guatemala. Ministerio de Educación.
Segundo Censo Nacional de Talla de Escolares de Primer Grado de Primaria de
la República de Guatemala. 16 al 20 de julio de 2001. Guatemala: Gobierno
de la República-COSAN/COPRE y Ministerio de Educación, 2002.
5) WHO Working Group. Use and interpretation of anthropometric indicators of
nutritional status. Bull WHO 1986; 6: 929-41
6) Gorstein J, Sullivan K, Yip R, de Onis M, Trowbridge FL, Fajans P, Clugston
G. Issues in the assessment of nutrition status using anthropometry. Bull WHO.
7) Dibley MJ, Staehling N, Nieburg P, Trowbridge FL. Interpretation of Z-score
anthropometric indicators derived from the international growth reference.
Am J CLin Nutr 1987; 46: 749-62.
8) Statistical Package for the Social Sciences (SPSS). Versión 11.0.1
para Windows. Chicago: SPSS Inc. 2003.
9) Loyola E, Castillo-Salgado C, Nájera-Aguilar P, Vidaurre M, Mujica
OJ, Martinez-Piedra R. Los sistemas de información geográfica
como herramienta para monitorear las desigualdades de salud. Rev Panam Salud
Pública, 2002; 12(6): 415-428.
10) República de Guatemala. Ministerio de Agricultura, Ganadería
y Alimentación. (SIG-MAGA), Marzo, 2001.
11) CINDI, USGS, CIAT, ESRI. Digital Atlas of Central America. Prepared in
Response to Hurricane Mitch. Version 2.0, January, 1999. CD-ROM.
12) Perry B, Gesler W. Physical access to primary health care in Andean Bolivia.
Social Science and Medicine 2000 (50): 1177-1188.
13) Martin D, Wringley H, Barnett S, Rodovick P. Increasing the sophistication
of access measurement in rural health care study. Health and Place 2002 (8):
3-13.
14) United States Geological Survey (USGS). http://edc.usgs.gov/products/elevation/dem.html.
Consultado en Noviembre de 2002.
15) World Wild Fund, World Bank, USGS-EROS. Ecoregions. Central America Environment
Projects: http://www.worldbank.org/
16) Mayhew S. A dictionary of geography. Oxford paperback reference. Oxford
University Press. Oxford 1997.
17) Meade MS, Earickson RJ. “Regionalization of diet and deficiencies”.
In:. Medical geography. The Guilford Press. Mew York 2000: 43-51.
18) FAO. Land and water development division. http://www.fao.org/ag/agl/landuse/
19) CIAT. Indicadores de vulnerabilidad. Centro Interamericano de Agricultura
Tropical.
http://gisweb.ciat.cgar/sig/esp/indicadores-vulnerabilidad.htm
20) Martínez R, Vidaurre M, Nájera P, Loyola E, Castillo-Salgado
C. SIGEpi: Sistema de Información Geográfica en Epidemiología
y Salud Pública. Boletín Epidemiológico OPS. 2001; 22(3):4-5.
21) PROARCA/CAPAS. Proyecto Ambiental Regional de Centro America /Central America
Protected Areas Systems, Central American Vegetation/Land Cover Classification
and Conservation Status. Partnership of the CCAD, USAID, IRG, TNC/NASA and
Winrock International. Obtained from the CIESIN at Columbia University via
FTP.
22) Martínez R., Loyola E., Nájera P., Vidaurre M., Castillo
C. Geographical distribution of chronic malnutrition in Guatemala, Honduras
and El Salvador. VI Congresso Brasileiro de Epidemiologia. Recife PE 19-23
Junho 2004.
23) Nájera P, Castillo C, Vidaurre M, Martínez R, Loyola E, Lizardo
E. Geographic Accessibility to Primary Health Care in Honduras: Urban and Rural
inquities. VI Congresso Brasileiro de Epidemiologia. Recife PE 19-23 Junho
2004.
24) Organización Panamericana de la Salud (OPS). Objetivos de Desarrollo
del Milenio y Metas de Salud. OPS: Washington, D.C., Documento SPP38/4. 2004.
Return to index
Epidemiological
Bulletin , Vol. 25 No. 1, march 2004