In recent years, there has been growing interest among ministries of health and other health sector institutions in the use of Geographic Information Systems (GIS) as a tool to strengthen the analytical, management, monitoring, and decision-making capacity in public health, as well as a tool for advocacy and communication between technical personnel, policymakers, and the general public. This interest is the result of: i) recognition of the GIS capacity for managing geographical dimensions, integrating health-related data from various sources, helping to discover and visualize new patterns and geographical relations in data that would otherwise be difficult to identify, and displaying these on maps that constitute a more expressive and visual representation; ii) technical meetings and congresses devoted to GIS in public health, as well as the inclusion of GIS as a topic in scientific events in epidemiology and public health; iii) publication of a significant number of articles that show the potential and uses of GIS in several areas, including epidemiological studies, public health management, and improvement of community health;1,2 and iv) the growing number of health studies and projects that are being developed by academic teams and health service professionals that include the use of GIS as a tool for analysis and results communication.
Notwithstanding these developments, the adoption of GIS in the health sector at local levels has been limited, primarily due to low level of access to commercial GIS programs, their cost, complexity, and limited availability of analytical techniques and methods for problem solving in epidemiology and public health. In response, efforts have been made to overcome these problems through the development of GIS software packages, mapping tools and methods for statistical spatial data analysis in different environments.
The purpose of this article is to inform public health professionals about the availability and current status of various GIS, mapping, and epidemiological analysis software, highlighting advantages and limitations in terms of their potential use in solving public health problems.
Geographic Information Systems in Public Health
An acknowledged definition of GIS refers to an organized set of computer technology (computer hardware, software packages, geographic and non-geographic data in digital format), methods, procedures, and personnel, designed for the capture, storage, retrieval, manipulation, display, and analysis of geographically referenced data; whose purpose is to support decision-making for the solution of problems that arise in a given geographical space.3
GIS software packages are sets of algorithms, methods, and automated procedures, implemented in a program with specific functions to guarantee these processes. The functions usually include the following:
- Entry, retrieval, and edition of cartographic and attribute data in different standardized formats and sources;
- Display and handling of multiple cartographic layers;
- Visualization of data in the form of maps, tables, charts, and layout;
- Management of multiple scales and projection systems, in layers and on maps;
- Creation of different types of thematic maps;
- Spatial data selection and queries, including attributes or geographical operations on one or more cartographic layers;
- Performing geographical functions, such as proximity, distance, etc.;
- Creation of buffer zones;
- Measurement of distance on maps and between geographical objects;
- Availability of a database management system that includes operations for relating nonspatial with spatial data;
- Geo-referencing and geo-coding of data;
- Capacity for development of new functions and customization of the software user interface using script languages;
- Capacity for managing and maintaining work or project sessions.
A detailed description of GIS generic functions can be found in other publications,4 as it is not the objective of this article.
GIS programs have evolved significantly in recent years, particularly in the improvement of user interfaces from command-line-based ones to graphic interfaces that are simpler and more user-friendly. The number of functions available for data management and processing has substantially increased, and operations previously considered to be highly complex have been integrated in simple and user-friendly ways. Of the commercial GIS packages currently available, the most prominent are ArcViewTM, ArcGISTM, MapInfoTM, MaptitudeTM, IdrisiTM, and GeomediaTM. From these, ArcViewTM and MapInfoTM are the most frequently used in epidemiological studies and public health applications.
From the public health perspective, the concept of GIS includes the design, development, and use of statistical and epidemiological methods linked with GIS. It also comprises the technology in for the description and study of the magnitude and distribution of health problems in populations, health situation analysis, surveillance of health events, epidemiological analysis, in addition to planning and evaluation of interventions, management, and decision-making. Given their multidisciplinary nature, GIS in public health is closely related to disciplines such as epidemiology, biostatistics, geography, and information technology in order to achieve their objectives.
According to the above concept and in addition to the generic, GIS software in public health must include specific functions in health-related data analysis, focusing on public health problems and under its specific context and terminology. However, commercial GIS software is deficient in public health or epidemiological methods, which are the foundation for health data analysis and solving public health problems. This is because these programs development has taken a general multipurpose approach, using concepts and terminology from geography, cartography, and information sciences. Although it is possible to carry out many health data analysis operations using current GIS applications, in most cases it requires complex processes involving multiple functions, along with knowledge of conceptual and methodological frameworks of GIS, epidemiology, and public health. This could demand highly skilled users. This issue, coupled with the low levels of access to commercial GIS software owing to cost, limited availability of staff trained in GIS, and restrictions on access to cartographic data in digital formats, constitute the principal barriers to wider adoption of GIS in public health.
There have been many efforts to develop GIS in public health in an attempt to overcome these barriers. The Public Health Mapping Program, in the Communicable Disease Surveillance and Response Department (CSR), of the World Health Organization (WHO), has developed HealthMapper to respond to critical information needs for surveillance in public health and programs for the prevention and control of communicable diseases.5 The Health Analysis and Information Systems (AIS) area, of the Pan American Health Organization (PAHO), has developed the SIGEpi software package, which is an integral part of its cooperative initiative to strengthen the analytical capacity in epidemiology and health.3,6,7 Also, the Division of Public Health Surveillance and Informatics of the Centers for Disease Control and Prevention (CDC) in Atlanta, United States, has developed the disease-mapping tool EpiMap as part of the epidemiological analysis package EpiInfo.8.9 These tools have played a key role at global, regional, national, and local levels.
In response to a request from the Assembly of the University Consortium for Geographic Information Science, held in the summer of 1999, Rushton et al. presented a series of proposals for improving GIS in public health, emphasizing the key themes in research on GIS in health and the need for using analytical epidemiology methods in GIS to effectively assist in determining the relationship between geographical patterns of disease distribution and environmental and social conditions.10
As a result, the interest of epidemiology and public health professionals in studying and analyzing geographical distribution of diseases and their relation to potential risk factors, linked to the possibility of managing spatial dimensions of epidemiological data through GIS, has stimulated the development of relevant statistical methods in both disciplines, particularly spatial statistical methods. These methods have been integrated into software packages such as DispmapWin,11 SpaceStat,12 DMAP,13 SaTScan,14 CrimeStat,15 GeoDa,16 ClusterSeer,17 EpiAnalyst, and ResearchAnalyst,18 some of which will be briefly commented on below. These developments have been the result of the intense activity aimed at developing spatial data analytical functions integrated into GIS.
Disease Mapping Tools and GIS software in Public Health
EpiInfo/EpiMap
EpiInfo and EpiMap were developed with the object of giving public health services, epidemiologists, and other health professionals an inexpensive and easy-to-use tool for epidemiological analysis, capable of managing data, analyzing epidemiological health data, and displaying results in the form of maps.
The design and development of the EpiInfo/EpiMap software system was guided by the need to cover the main functions and procedures for disease surveillance and epidemiological studies, in response to the needs of CDC and WHO. It generally consists of a group of closely related programs: MakeView permits the creation of questionnaires and databases; it offers functions for data entry, editing, validation, consistency check up of data based on the designed questionnaire. Once the data are entered and validated, the Analysis program allows the user to perform statistical and epidemiological analysis, presenting results in the form of tables and graphs. EpiReport is for combining analysis´ results and other data processing, making possible professional presentations that can be stored in HTML format for publication and distribution on the Internet.
EpiMap is the program for displaying the results of analyses carried out in EpiInfo, as well as other data and indicators, on maps. It contains a small number of GIS functions. It allows data geo-referencing from individuals and health events, based on geographical variables such as residence, work address, or other geographical references. It also provides tools for the creation of thematic maps using intervals, graduated symbols, single values, or dot-density methods. However, it does not provide functions for operations on geographic data or statistical methods, offering basically the capability of visual inspection of the geographic relations displayed on the map.
EpiInfo/EpiMap is an indispensable analytical tool for any health team or health unit engaged in epidemiological research and field studies. It offers a wide range of methods for meeting most needs in epidemiological studies, such as outbreaks or other public health analyses. It does not include methods for statistical spatial data analysis. It runs on the Microsoft Windows operating system platform (95/NT/98/2000/Me/XP) and it has good user documentation, with examples that facilitate learning the program. The software package, documentation, cartographic data, and examples, along with other related resources, can be downloaded from the CDC website (http:/www.cdc.gov/epiinfo/downloads.htm). Its online distribution is free. If manuals and other printed materials are required, the cost is low.
HealthMapper
HealthMapper was developed by CSR/WHO with the initial objective of building a system for mapping Guinea Worm Disease, strengthening epidemiological surveillance of communicable diseases, through the creation of a basic database containing cartographic data and indicators commonly requested by other priority disease control programs. Its particular focus is on the African countries. The original objectives were later expanded for meeting the needs of other control programs such as malaria, HIV/AIDS, lymphatic filariasis, onchocerciasis, leprosy, epidemic diseases, and tuberculosis. It has also expanded its application in other regions of the world.
The design and development of HealthMapper was based on the following premises: i) a ready to use cartographic digital database, with administrative boundaries maps, and environmental factors such as rivers, lakes, elevation; as well as basic health data and indicators, like schools, health infrastructure services, and drinking water supply; ii) a simple data management system allowing the entry and updating of health indicators related to cartographic data in a previously standardized form; iii) an accessible and user-friendly interface with automated functions for creating maps, tables, and graphs; iv) a system that operates from local up to global levels, mainly under the conditions of countries in Africa; and v) an alternative tool that can be used free of charge or at low cost.
HealthMapper is aimed at simplifying the processes of collection, storage, updating, retrieval, and analysis of data for epidemiological surveillance, in particular, and public health, in general. It provides a basic set of geographic information system functions, mainly those for mapping and displaying thematic maps. Its main users are public health professionals and policymakers working at national and local level.

The package includes three main components: database, data manager, and mapping interface. The database component, essential to HealthMapper, is a collection of standardized cartographic data that has been developed through direct collaboration with countries’ authorities and integrates data from health and other sectors. It currently contains cartographic data for most African and Southeast Asian countries, with a process for continuous and systematic data collection, updating, and standardization. It uses the MS Access database management system for data, making it possible to import and export tables in other formats. Moreover, it has a function for importing geographic data directly from Global Positioning System (GPS) receivers.
The Data Manager component has an interface that allows the user to link indicators to cartographic data for mapping and analysis. This component has three basic functions:
1) to serve as an interface for updating and maintaining the cartographic data;
2) to allow the linkage of health indicators with cartographic data;
3) to facilitate the transfer of indicators from one level of aggregation to another.
The mapping interface provides a series of functions used most frequently in mapping and basic spatial analysis in public health. This allows the user to visualize and analyze the data through thematic maps and graphics. The key functions of this component include: generation of thematic maps with intervals, graduated symbols, and dot-density format; location and selection of geographical units, measurement of distances, zoom-in and zoom-out (change of map scale); overlay of multiple layers on the map such as topographic relief, roads, rivers, health units, schools, towns, and drinking water supply points; creation of areas of influence; calculation of rates taking into account the population and the number of cases within a given radius of a selected point; creation of graphs based on selection of geographical units to evaluate trends or compare indicators in time; creation, storage, and retrieval of the most frequently used maps.
This software is a tool to support health surveillance and disease prevention and control programs. Its use in countries not included in the database requires at the first stage, the preparation of the cartographic data, health indicators and other data of interest. The indicators’ database has a predetermined structure that is managed by the data manager component. In a second stage, it requires the definition of relationships between indicators and cartographic layers, all by units of analysis and levels of aggregation. Once the two stages are completed, the creation of thematic maps, health and other data included in the database is straightforward and easy to carry out. HealthMapper has a user-friendly interface that facilitates its use, with most of the functions presented in simplified form.
HealthMapper is very useful for people who need a tool to maintain a set of aggregate indicators organized by different administrative units (e.g., states/departments/provinces, municipalities, localities) and to have the ability to generate and display thematic maps. It is important to note that these functions are the ones most frequently used and requested by most health surveillance units, as well as the disease prevention and control programs. The epidemiological analysis capacities that HealthMapper offers are limited, as they are oriented more to the descriptive component of the distribution and magnitude of health risks and their determinants. It is stand-alone software, it is independent of other application platforms and requires the Windows operating system (Windows 98/NT/2000/Me/XP). Its distribution is free or inexpensive and is based on institutional agreements with CRS/WHO.
SIGEpi
SIGEpi was developed by AIS at PAHO with the purpose of contributing to the attainment of the objectives of strengthening analytical capacities in epidemiology and public health in the Region of the Americas and overcoming some barriers restricting the use of GIS in public health. Its design and development was guided by the premise of offering public health users a versatile platform-independent GIS tool that does not rely on other commercial GIS software. It includes: i) most GIS functions and some additional simplified functions, ii) methods for analyzing data on health and its determinants, including descriptive and exploratory techniques and techniques for estimates of risk measures, clustering detection, and identification of health needs and priorities, making it possible to effectively support evidence-based decision-making; iii) a friendly GIS environment, both easy to use and oriented to public health; and iv) a low-cost alternative GIS tool that can be used by health services at the local, national, regional, and global levels.
The audience and potential users for SIGEpi are public health professionals, technical personnel, and health units and services managers at different decision-making levels of the countries: as well as researchers and other professionals who need to analyze health data with geographical references. It is a platform independent of other programs, developed to run on the Windows operating system family (Windows 98/NT/2000/Me/XP).
The graphic user interface for SIGEpi contains multiple windows and types of documents, including Projects, Maps, Tables, Graphs, Results, and Layouts, each with its own specific functions, menus, and tools.
The SIGEpi program has a Relational Database Management System (RDBMS) that uses MS Access native format (.mdb) = and permits data interchange in other formats such as Dbase, Excel, Btrieve, EpiInfo, and delimited ASCII text, as well as data tables from EpiInfo version 6.x (.rec). It is an open system from the data management perspective, allowing the user to include and manipulate data without a structure established a priori. With this model, the user can create the database, create the structure for tables and/or import existing data tables produced by other standard information systems or study-specific data. Its RDBMS is integrated into the system, allowing processing of non-spatial data without the need to resort to other programs. Providing specific dialogue boxes for this purpose makes it possible for the user to interact with the database and create queries for table generation containing new variables, measures, and indicators. This approach does not require the user to know the Relational Database Model Structured Query Language (SQL)2 to process data, facilitating its use by less experienced professionals. Database tables can be linked with
cartographic layers on the map, permitting visualization of the variables and their use in geographical operations and other analytical procedures.

The Map window is the specific interface for managing maps and cartographic layers. This offers a significant number of GIS functions, beginning with the simplest ones including the opening of layers and the definition of their graphic properties, changes in scale, interaction with the map and the extraction of information, and graphic selection of units from layers, among other things. It also has other complex functions, such as the selection of geographical units from a layer based on another layer (spatial query), and the creation of geographical layers based on geographic data from GPS receivers, as well as the raster images geo-referencing. The system for managing the geographic bases has the capacity to handle and process files in the most common formats, such as ESRI Shapefile and other standardized formats including various image formats. It also manages border files from EpiMap version 2 (.bnd). The map’s window, the attribute tables for cartographic layers and graphs are dynamically linked, so a selection made in one of them is reflected in the others. The common GIS functions implemented in SIGEpi are not detailed here, since they are not the focus of this article and can be found in other publications.
SIGEpi provides the following methods for analysis of health data:
- Descriptive statistics: This includes the frequency distribution calculation, in addition to measures of central tendency and dispersion, all useful during data exploration. Contains also correlation analysis functions, which allow the identification of associations among variables and determination of co-linearity between indicators, an important step for selecting indicators to include in a model. Also has available linear regression analysis, which offers the capacity to build simple and multiple linear regression models, supporting ecological data analysis.
- Risk estimates: This includes crude and specific rates, ratios, and proportions calculation; rates standardization by direct and indirect methods, which is important for adjusting risk estimates for confounding factors; spatial rates smoothing and spatial estimates for standardized of mortality and morbidity rates based on Bayesian methods, which are useful for eliminating variability in data when working with small areas, with uncommon diseases, and generally speaking, diseases with small numbers. These methods are also useful when the purpose is to improve the risk estimate power and help visualize the spatial trend of an estimate.
- Identification of critical areas and population groups: This simple interface assists in the construction of a complex conditional expression with several variables and indicators, facilitating identification of geographical units and population groups sharing the worst conditions. The use of different classification methods facilitates the selection of cut-off values for each element in the expression. The identification of critical areas can be complemented with geographical conditions applying the cartographic layer’s queries functionality.
- Construction of Composite Health Index: This helps the prioritization of health needs and interventions through a method that constructs a composite index by standardizing indicators in different measurement units. A simple interface permits the selection of indicators to include in the model, defining the direction of each with respect to the index being constructed. This is useful in determining unmet health needs and priority areas and population groups in greater need. It is also possible to give standardized weights to the indicators included in the model. The Composite Health Index makes it possible to synthesize information on a health problem from several dimensions, and they has diverse uses.
- Spatial Clustering. These methods are relevant for epidemiological surveillance and public health, particularly for detecting clusters of geographic units in which a parameter under observation deviates from the expected value and the identification of risk factors and contextual determinants for etiological hypotheses formulation. For identifying the presence of global spatial clusters, the Moran’s I and Geary’s c global spatial autocorrelation indexes are applied. Calculations of local indices of spatial autocorrelation (LISA) are also included to identify the location of clusters of high and low values in aggregate data. Also included in this section is a method for detecting spatial-temporal clustering using the Knox test, which permits measurement of association in space and time for disaggregated or individual health events.
- Measurement of association between environmental exposure factors and health effects, applied to epidemiological studies at the individual level. This method uses the locations on the map of both individual case data and environmental or ecological factors in the area studied and permits calculation of different epidemiological measures of association between exposure to the environmental factor and the health effect. The results include confidence levels, contingency tables, and stratified analysis, if required by the user. The measures of association are useful in epidemiological cohort and case–control studies.
All the functions and methods have interfaces whose design employs the perspective, language, and conceptual framework of epidemiology and public health. SIGEpi provides a significant group of GIS functions, although it has limitations in editing geographic databases. Nevertheless, it offers functions for the generation of cartographic point or lines layers from tables with variables of coordinates of latitude and longitude, along with data derived from GPS receivers.
SIGEpi is useful for anyone needing health related GIS applications aimed at:
1) studying the number and spatial distribution of health events in the population;
2) identifying critical population groups and geographical units;
3) estimating the risk of becoming ill or dying;
4) conducting analyses of the association between risk factors and determinants with possible health effects;
5) identifying and laying out etiological hypotheses;
6) carrying out analyses of health status;
7) monitoring health events and their determinants;
8) prioritizing and targeting health actions and interventions; and
9) monitoring and evaluating health interventions. Although SIGEpi is designed for applications in epidemiology and public health, it can be used as a GIS tool in other disciplines and sectors.
Its distribution is based on an inexpensive license. The software package and other related materials can be downloaded from the Internet at http:/ais.paho.org/sigepi/index.htm?xml=sigepi/soporte.htm. The related materials include a user’s manual, an on-line help system, and case studies with companion data sets that describe step by step how to carry out procedures for solving public health problems.
AIS at PAHO will continue to provide support for the development of SIGEpi, given its significance as a technical cooperation instrument for strengthening analytical capacity in epidemiology and public health along with evidence-based decision-making.
DispmapWin
DismapWin is a program for advanced statistical analysis of epidemiological data, developed by Schlattmann of the Benjamín Franklin University Clinic, Free University of Berlin. This program permits the mapping of health data and provides measures of risk such as crude rates and ratios. The analytical methods it offers include the analysis of unobserved heterogeneity in epidemiological data using mixed models, also called hierarchical or multi-level analysis. It also offers the capacity to carry out ecological analysis using the Poisson regression model, adjusting the spatial dependency of the independent variables through a mixed regression model.20. 21
The analytical functions of this program can be grouped into two types: i) descriptive spatial statistical measures; and ii) statistical modeling. In the first category, methods are presented for identification of the presence of clusters and spatial heterogeneity through the Moran and Ohno-Aoki tests. These methods allow detecting the existence of dependency or spatial heterogeneity in measures of effects and health risks, providing indications on the existence of exposure factors in specific population groups and geographical units. For statistical modeling, the program provides mixed regression models, which make it possible to adjust for the effects of dependencies and spatial heterogeneity of data when modeling the relations of possible risk factors and a measure of effect.20
DismapWin reads data files in ASCII and dBase III format and uses the boundary file format of EpiMap version 2 (.bnd), it can handle basically geographic data in the form of areas or polygons. It includes limited GIS functions, restricting them to the display of thematic maps with intervals using percentile classification. Risk estimates based on mixed regression models are displayed in thematic maps, including maps of levels of significance. This program is platform-independent, not requiring other programs. It is free and can be downloaded from its website.11 From the standpoint of application and use, it is relevant to processes for spatial statistical modeling of health data.
GeoDa
GeoDa is a program designed for exploratory analysis of discrete spatial data in the form of points and polygons, offering an important group of statistical methods for spatial data analysis. Its main objective is to provide a user-friendly graphic environment with a natural route for empirical spatial data analysis, beginning with mapping and simple visualization, continuing to exploration and analysis of spatial autocorrelation, and ending with spatial regression. It was developed by Anselin and co-workers at the Spatial Analysis Laboratory of the Department of Agricultural and Consumer Economics at the University of Illinois, Urbana-Champaign.16
This software has its origin in the first efforts to bridge the statistical software packages with ArcInfo GIS program. These efforts led to the development of SpaceStat and its extension for ArcView,23 and DynESDA and its extension for ArcView, which introduced the concept of dynamically linked windows (“linking and brushing”) in a GIS environment. These solutions required ArcView for construction of the neighborhood matrices and spatial weights..
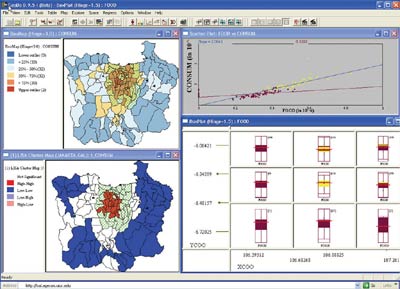
GeoDa’s design consists of an interactive environment that combines maps with statistical graphs, using the technology of dynamically linked and brushed windows. In general terms, its functions can be divided into six categories:
1) utilities and manipulation of spatial data: data input, retrieval, and conversion;
2) transformation of data: transformation of variables and creation of new variables;
3) mapping: creation of thematic maps, cartograms, and animated maps;
4) exploratory data analysis: creation of several kinds of statistical graphs, such as histograms, box diagrams, and scatter diagrams;
5) spatial autocorrelation: statistics of global and local spatial autocorrelation with inference and visualization; and
6) spatial regression: diagnosis and estimates of parameters for spatial regression models. More details on the design and functions of GeoDa can be found in other publications.
GeoDa has capacities for generation and visualization of maps, although its GIS functions are very limited. It is a tool that meets several analytical needs in epidemiology and public health. However, the terminology and orientation are focused on professionals in disciplines such as statistics, spatial analysis, and econometrics in general.
This is an independent platform program that runs on the Microsoft Windows operating system (Windows 98/NT/2000/Me/XP), as well as on virtual emulators for Windows on Mac operating systems (MacOS 9 and MacOS X). It is free and it can be downloaded from the Internet. It has a good documentation; its user’s manual adequately describes the use of the functions and details the implemented methods, uses, and results interpretation.
Programs for Statistical Analysis of Spatial Data Requiring GIS